Here I am collecting, among other stuff, some mathematical problems that I found interesting and worthy of some articles or short stories, which can be read in the Activity page. For example, one of the most recent and fascinating which I analyzed was computing the expected time required for some balls randomly moving around a circle of bowls to gather together in a single bowl (here).
In 2022, Garritt Page and other authors created a Bayesian model, the DRPM (Dependent Random Partition Model), for clustering spatio-temporal data. That is, we have \(n\) subjects, or units, that measure some target variable and that are placed somewhere in space, and want to cluster them at each time point \(t=1, \ldots,T\); thus creating a sequence of clusters configurations.
So far it's nothing new, there were already other models that could do this. However, what characterizes DRPM is the direct modelling of time dependencies in the clusters sequence, i.e. how the partition at time \(t\) is influenced by the one at time \(t-1\). In this way, clusters are generated taking into account both spatial and temporal information, ultimately producing a much smoother, gentler and therefore more interpretable evolution of the clusters. Other models, on the contrary, do not take into account the time dimension, thus generating each partition independently and disconnected from each other.
My thesis work has been to improve the model, or to generalize it, using a more cautious term. In doing so, I acted on several aspects:
Other than space and time information, I additionally incorporated covariates into the clustering process (i.e., in their prior of the partition, using the more appropriate Bayesian slang). The information provided by the covariates is indeed of great importance. For example, if the target variable to clusterised is PM10, as in the tests we performed, then other environmental variables such as wind intensity and direction, amount of rain, traffic, presence of industries, etc (the covariates) would be very useful for producing more precise and characterized clusters.
I slightly revised the model formulation, choosing different distributions for variances that ensured a greater precision in the sampling algorithm of the various model parameters. Moreover, I introduced a regression term in the likelihood, therefore providing greater flexibility allowing one to include the information of covariates also in this part of the model.
I allowed the model to accept missing data. In fact, the original version only worked on complete datasets, but in real scenarios often some data can be missing, for example due to failures or malfunctions of the measurement sensors. To implement this new feature, I derived an update rule that allows the model to sample even the missing data values.
I developed a new model implementation. The original one was written in C and it was actually a bit slow; so this time, for writing the new sampling algorithm of the model once my modifications were integrated, I chose Julia. Writing it in Julia resulted in much faster version, with peaks of speedup around to 2x (i.e. my model now takes half the time to be fitted, compared to the original version written in C).
All the work was conducted in R and Julia, with also some C experiments on the old code. Everything is available here.
Link diretto al pdf qui. Direct link to pdf here.
We applied Bayesian models to cluster spatio-temporal data about air pollution in the Lombardy region of Italy. We took the data from the ARPA site, where they were publicly available, which we then cleaned and transformed to derive a final dataset composed by weekly measurements of PM10, along with other environmental variables, for the year 2018 (we choose this year for reasons related to stability with respect to covid-inducted anomalies and missing values). Then we performed spatio-temporal clustering, meaning that, for each model, we derived a sequence of clusters (hence, the "temporal"), one representing each week of data, identified by labels attributed to the locations of the measuring stations (hence, the "spatial").
We tested four models to analyse and compare their different characteristics as one was purely spatial (sPPM), one included space and time information (DRPM), and the other two included covariates information (Gaussian PPMx and Curve PPMx). Therefore, only the DRPM was capable to naturally incorporate the time component into the clustering process, directly producing the sequence of clusters. On the contrary, for the other models we had to fit them independently at every time instant, manually producing the sequence of clusters.
We managed to identify interesting patterns of the clusters and to interpret their root causes, especially thanks to the results provided by the models which included covariates. For example, we identified a set of morphological variables and anthropological factors which most relevantly affected the pollution levels of the clusters. All our results were summarised in the report that follows.
We also created a dashboard as a web page, combining some html and javascript, and also as an R Shiny Dashboard (however, this is only a draft). This allowed to better showcase and guide the analysis and interpretation.
All the work was conducted using R, and everything is available here.
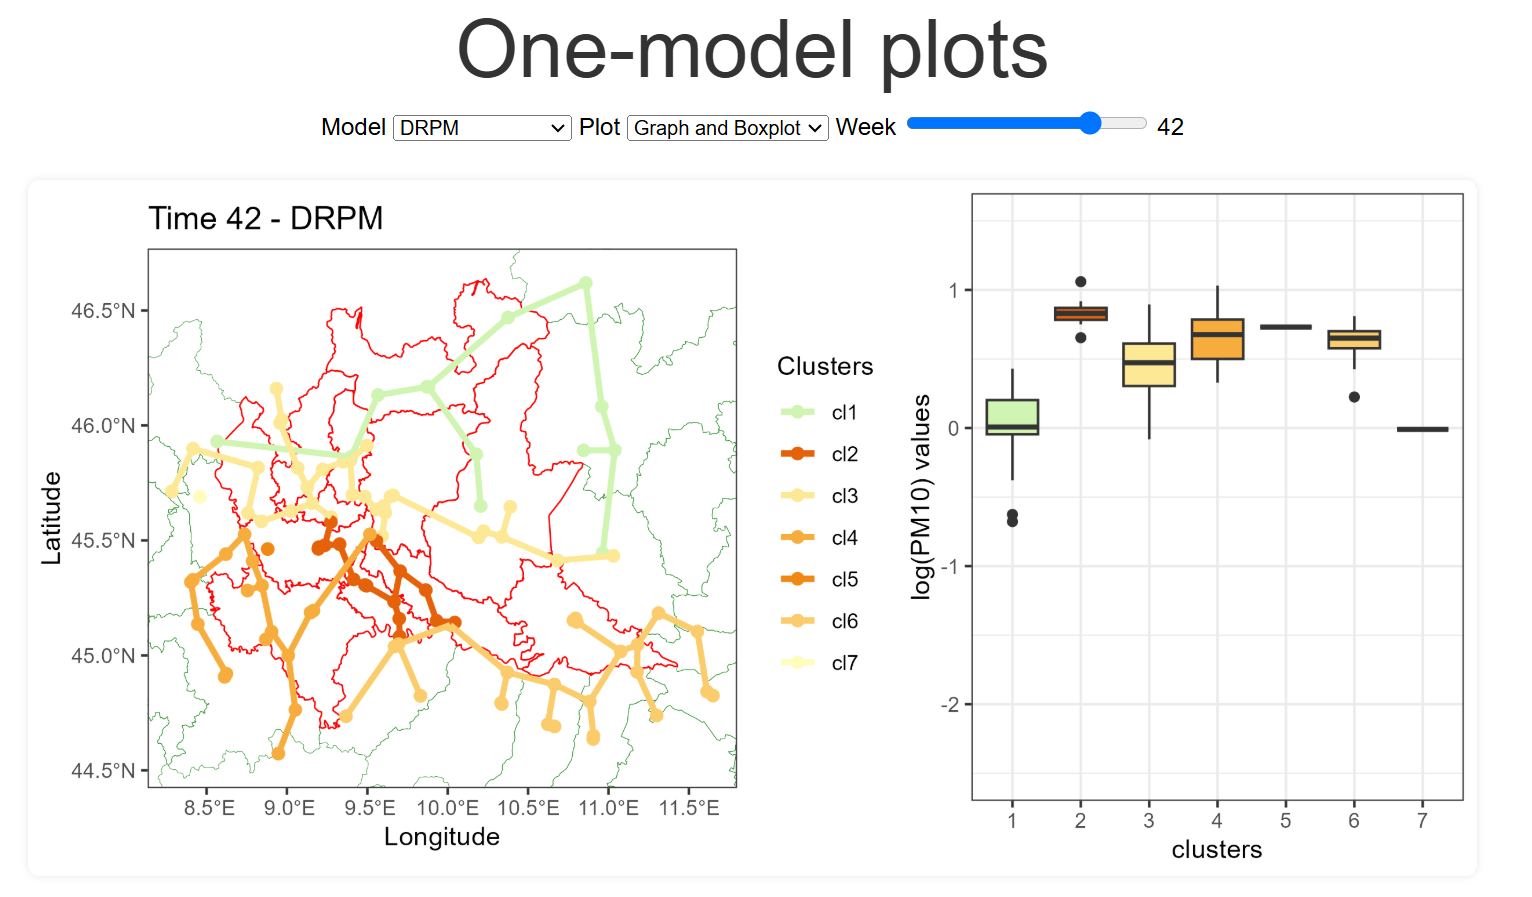
final dashboard, created as a web page using html, css, and javascript
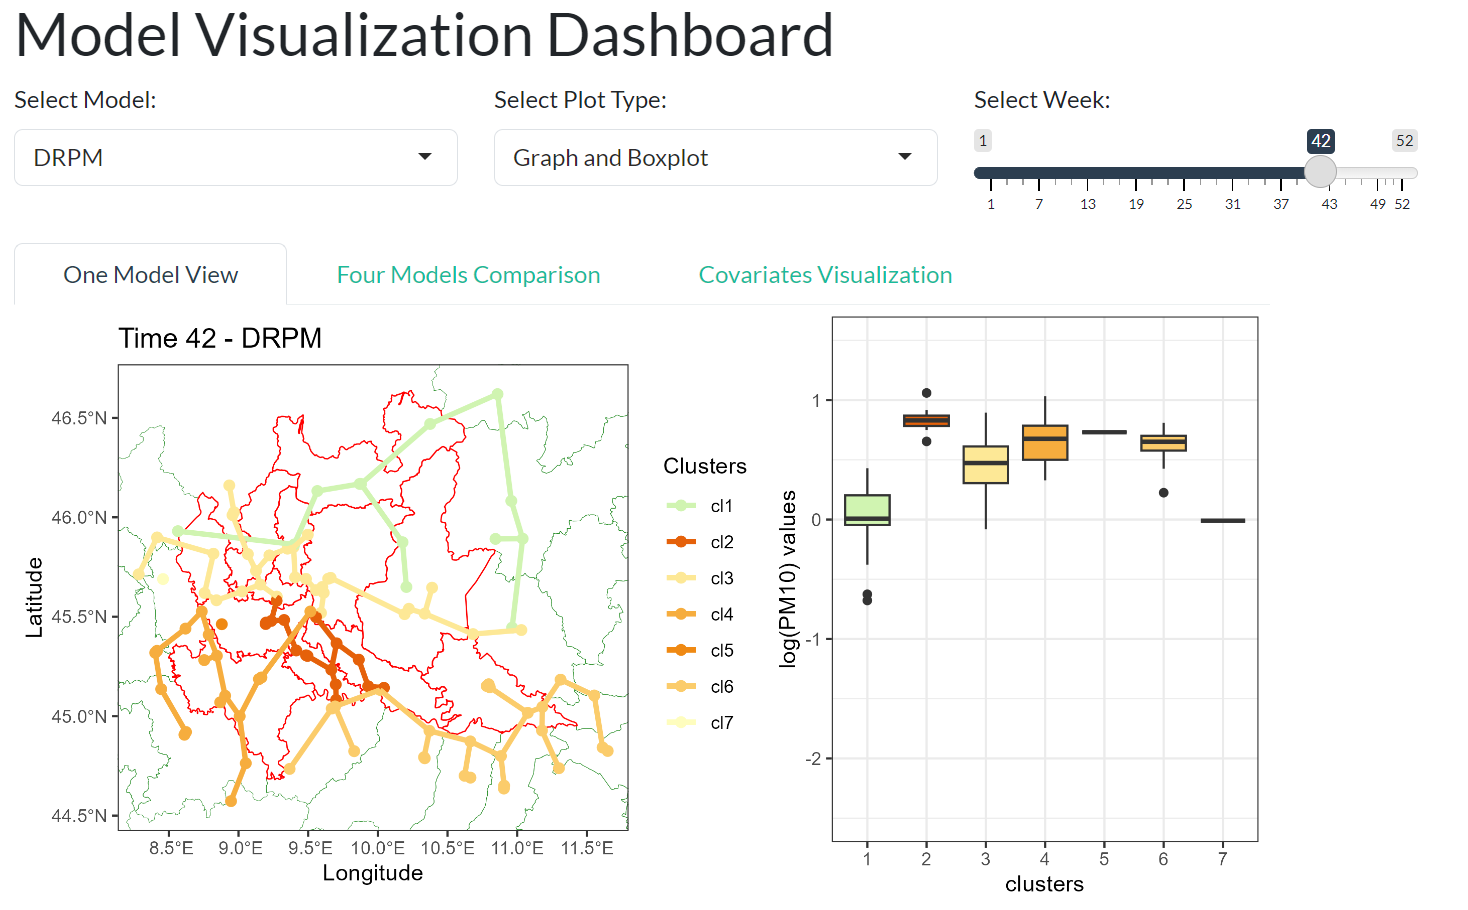
draft of the dashbobard created using R Shiny Dashboard
Link diretto al pdf qui. Direct link to pdf here.
In this project we had to develop a statistical process monitoring algorithm to detect defects in 3D-printed objects using control charts, the method we learned at lectures. We firstly performed a deep analysis of the images, applying them several transformations and operations to precisely isolate each 3d-printed object, and secondly we calculated some relevant geometrical variables (such as perimeter, area, and curvature) as well as more specific variables devoted to structure of the printed object (number of voids, area of the voids, etc).
In the end, testing our algorithm, we managed to achieve an accuracy of 95%, correctly classifying 38 objects (between intact and damaged ones) out of the 40 available in the dataset.
All the work was conducted using Python, and everything is available here.
Link diretto al pdf qui. Direct link to pdf here.
In this project we had to develop a statistical analysis on a topic at our choice. We studied the PISA dataset, which contains data collected from students around european high schools. Our goal was to study their well-being, both
psychological (do they believe in themselves? can they bear school failures and successes? are they scared about their future? etc);
and social (do they feel supported by their families, classmates, and teachers? do they suffer some bullying events? etc).
We applied several statistical techniques such as linear mixed models, random forests, PCA, Manova and Anova, to derive in the end a complete understanding of the variables that could improve the well-being (e.g. increasing the presence of books at home, having more possibilities of playing sports, renovating the school facilities, giving specific training of the teachers, etc), as well as a final ranking of the schools around Europe, as the title "Where are the happiest students?" suggests.
To explain our results, we composed the following poster, as well as developed an interactive game through a Telegram bot, to make the player impersonate the Minister of Education, for a state of their choice, and decide where should they spend their budget in order to improve the well-being of the students of their country. A final scoreboard of the players was also available online, and updating in real-time, to make the players see how they position themselves, and against to each other, according to their strategy.
All the statistical work was conducted in R, while the bot development in Julia. Everything is available here.
Link diretto al pdf qui. Direct link to pdf here.
In this project we had to develop a solution through a neural network to solve two challenges:
detecting if a plant is healthy or unhealthy based of pictures of their leaves;
developing a tool for time series forecasting.
Personally, I don't really enjoyed this approach of neural networks; I prefer more theoretical validated methods, as the more statistical ones employed in the other projects, rather than just letting a network learn and "hope for the best" by tuning its structure and parameters. Nonetheless, it has been an interesting project.
Here, all the work was conducted using Python.
Link diretto al pdf qui. Direct link to pdf here.
Link diretto al pdf qui. Direct link to pdf here.
In the first year, at the fourth computer lab of the "Informatica A" course, one of the exercises was to implement the game of 15 in C, the one with the 4 by 4 grid, an empty cell, and the numbers inside to be reordered. But, while I was there, I took the opportunity of having some little more fun and I implemented the game in its generic dimension, \(N\) by \(N\). In this way, the "15 game" extended into the "\((N^{2}-1)\) game".
The original code was written in C (here is the code) but here you can find an equivalent (and playable!) version which uses html and javascript.
About the game design, it is worth noting that the initial board cannot be simply initialized with random numbers, as otherwise one could get unsolvable configurations as this one
\[ \begin{bmatrix} 1 & 2 & 3 \\ 4 & 5 & 6 \\ \bf{8} & \bf{7} & \square \end{bmatrix} \]where numbers 8 and 7 cannot be exchanged. Therefore for the initialization of the board, as well as to adjust the difficulty of the game, the code starts from a solved board and applies to it random moves for some time, so that we shuffle the sequence of numbers while preserving the possibility of solving the game.
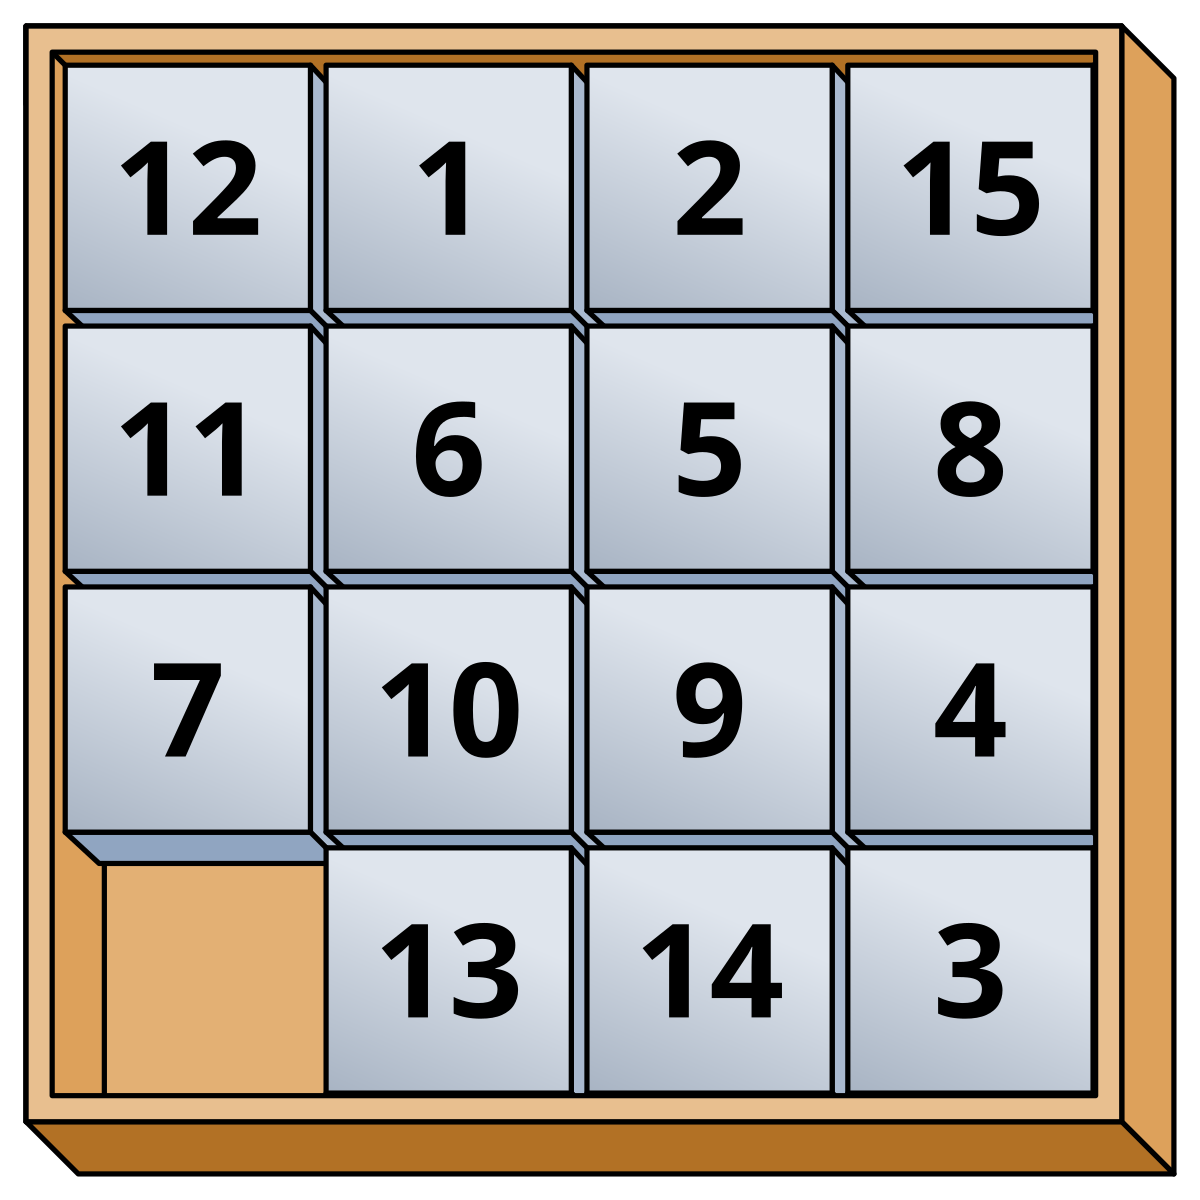
classic 15 game
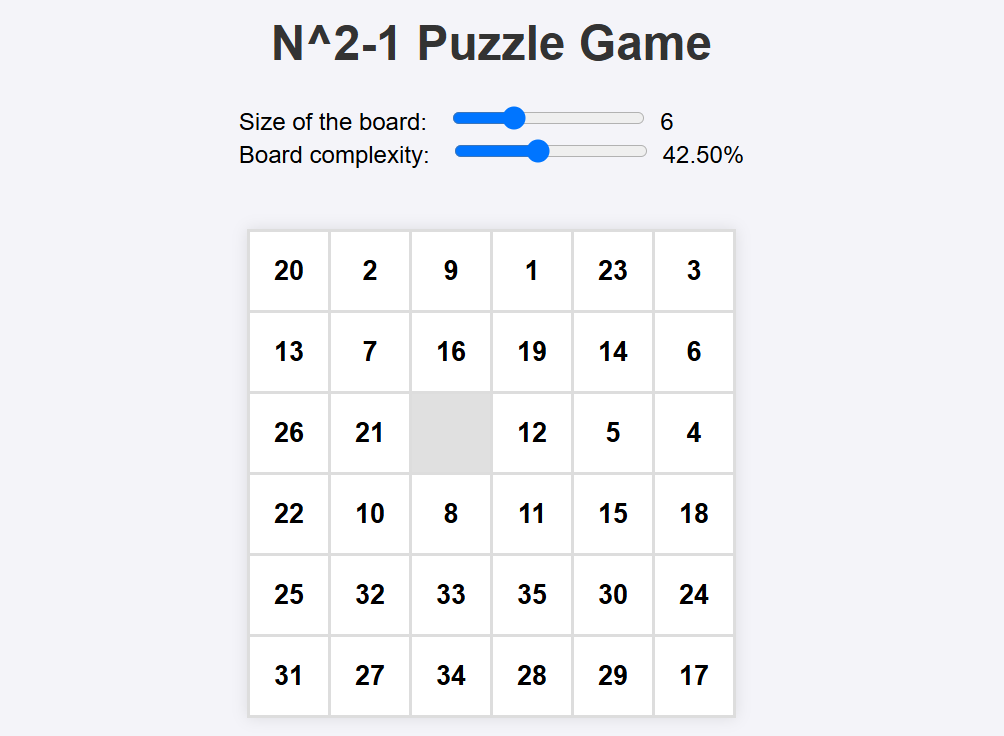
generalized 15 game
Quoridor is a very interesting game but unfortunately not very popular, yet. I think that its charm derives from being a game with very simple rules but which becomes complex and entertaining due to the wide possibilities of strategy. Something like chess but without the eccessive complexity of the opening strategies.
The rules state that each player has a checker that, in order to win, has to reach the other side of the board, and during the travel can place some separators, the walls, which can either facilitate his path or hinder the one of the opponent (but always leaving him a way to get to his goal, i.e., the opponent can not be "trapped"). So one has to face several decisions: when to move, when to place a wall, where to place it, if to place it with a short term view or for the endgame, etc; hence the complexity and attraction of the game.
Given these interesting premises, me and my friend Ettore started to code the game, especially with the aim of developing some AI agents that would fight against us or themselves in a tournament. For now it is just a work in progress, and here you can find the code written in C++ by Ettore or in Julia by me. The rules and the interface have been implemented, so the game is playable, but it remains the complex and funny part of developing the AI agents. For now in Julia two agents are implemented: rand_AI, which plays randomly, and target_AI, which greedily moves following the shortest path to the victory.
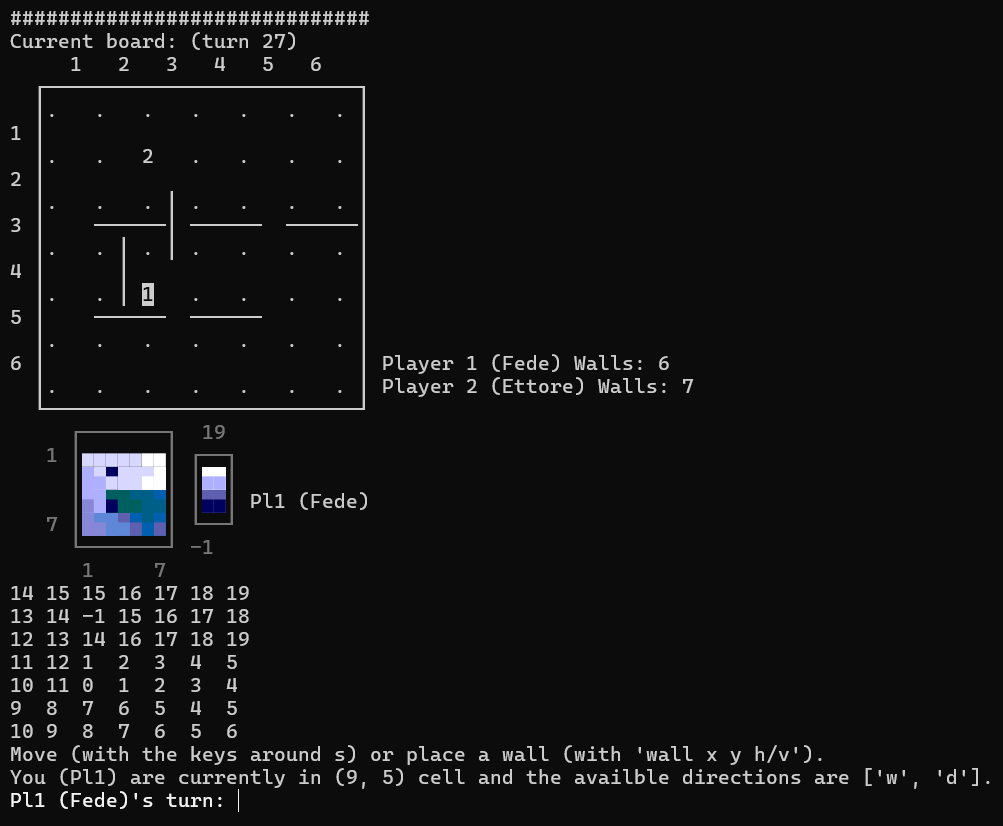
example of the gameplay interface in Julia
I developed this small project to merge all the pdf's which professors provided us for their lessons. This because I didn't like the idea of keeping them separate while they are jointly connected by the flow of the course: I wanted to assemble them into a single and tidy document which would condense all the material. This union task was easy, there are already several tools to combine pdf's; the additional requirement that I introduced was to combine their table of contents, so to keep the tidyness of having a pdf divided into (clickable) sections and subsections also in the final document, easing the studying task of quickly wandering around the course material.
In other words, the script combines each input pdf into the final document while also introducing a global table of contents where the name of each input pdf becomes a Section, and the corresponding sections of the input file become Subsections of the newly introduced Section in the final file.
In the end, I managed to implement this idea using a bash script, which you can find here.
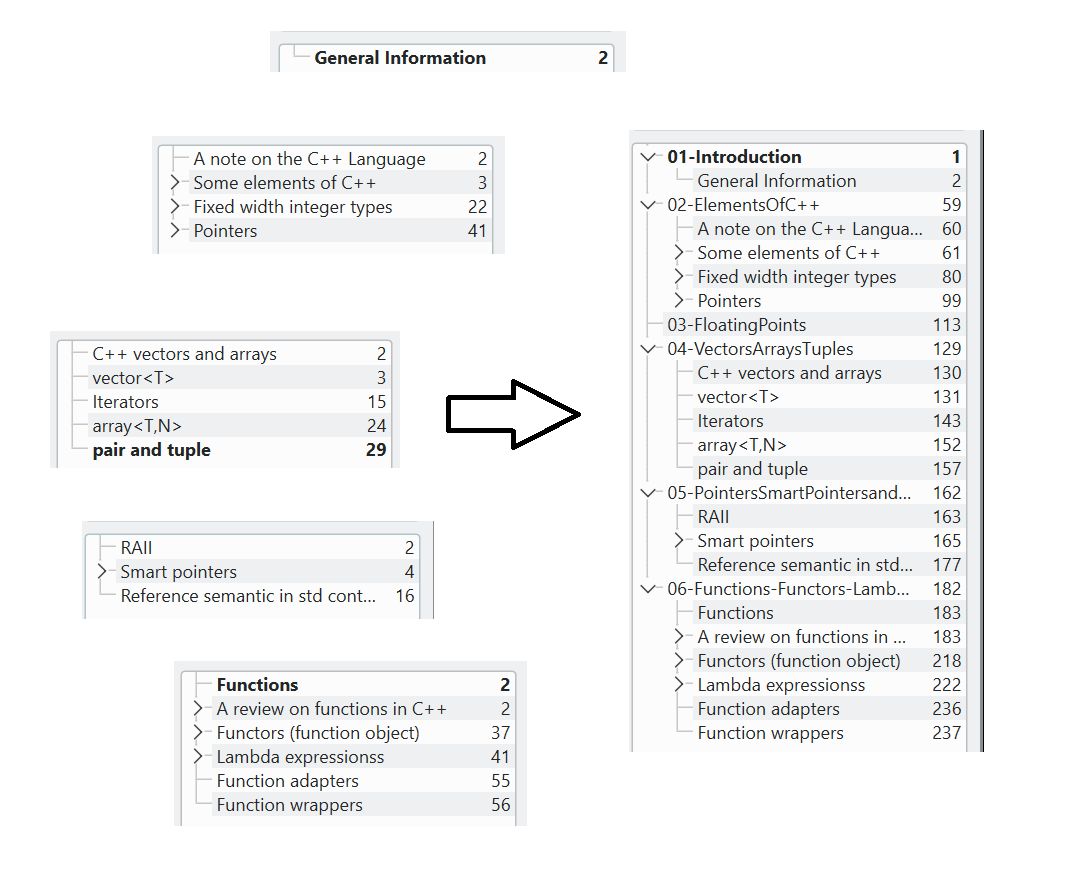
representation of what the script does
This is a project that probably dates back to high school years where, inspired by the periodic table hang on the wall of the classroom, I tried to build words and phrases using the elements from the periodic table as letters. I implemented this idea with some C code, available here, which is also proposed here through a conversion to javascript.