In this project from the Bayesian Statistics course we applied several Bayesian models to cluster spatio-temporal data about air pollution levels in Lombardy, Italy. The datasets used came from the ARPA site, the italian institution for environment protection. After cleaning and processing them, we derived a final dataset composed by weekly measurements of PM10 levels in 2018 (year chosen for reasons related to stability with respect to covid-inducted anomalies and substantial absence of missing values), along with other meaningful environmental variables, such as traffic, precipitation levels, wind information, etc. On the main target, PM10 levels, we performed spatio-temporal clustering using four different models: one was purely spatial (sPPM), one included space and time information (DRPM), and the other two included only covariates information (Gaussian PPMx and Curve PPMx). Only the DRPM model was capable to incorporate the time component directly into the clustering process, effectively producing a real sequence of clusters; while for the other models we had to fit each of them independently at every time instant, manually producing, in this case, a sequence of clusters by concatenation of the various results.
We identified interesting patterns in the generated clusters and also interpreted their root causes, particularly thanks to the results provided by the models which included covariates. For example, we identified a set of morphological variables and anthropological factors which most relevantly affected the pollution levels of the clusters. All our results were summarized in the report that follows.
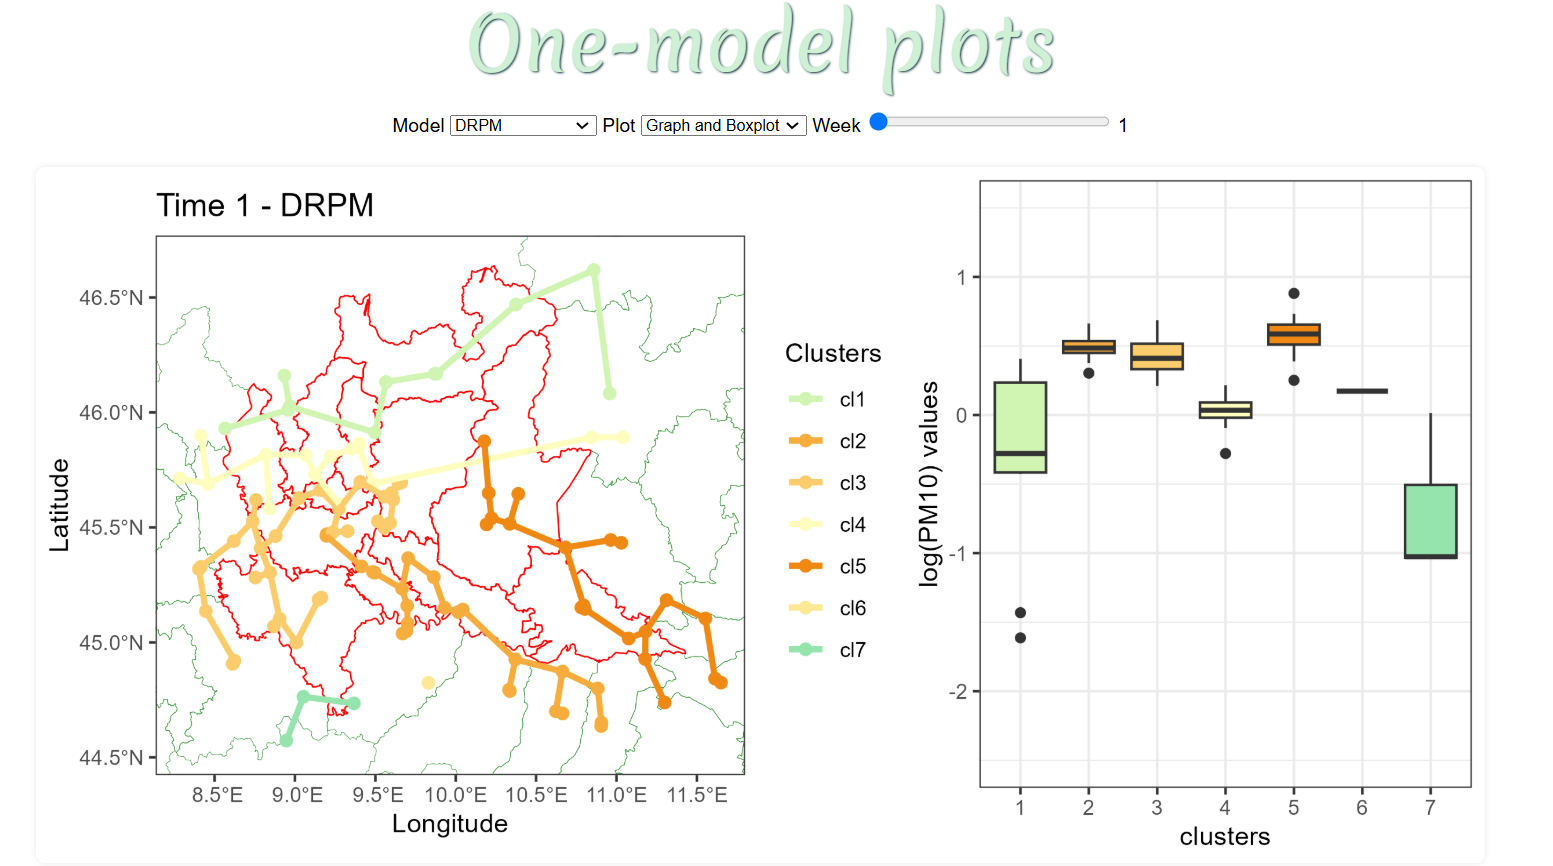
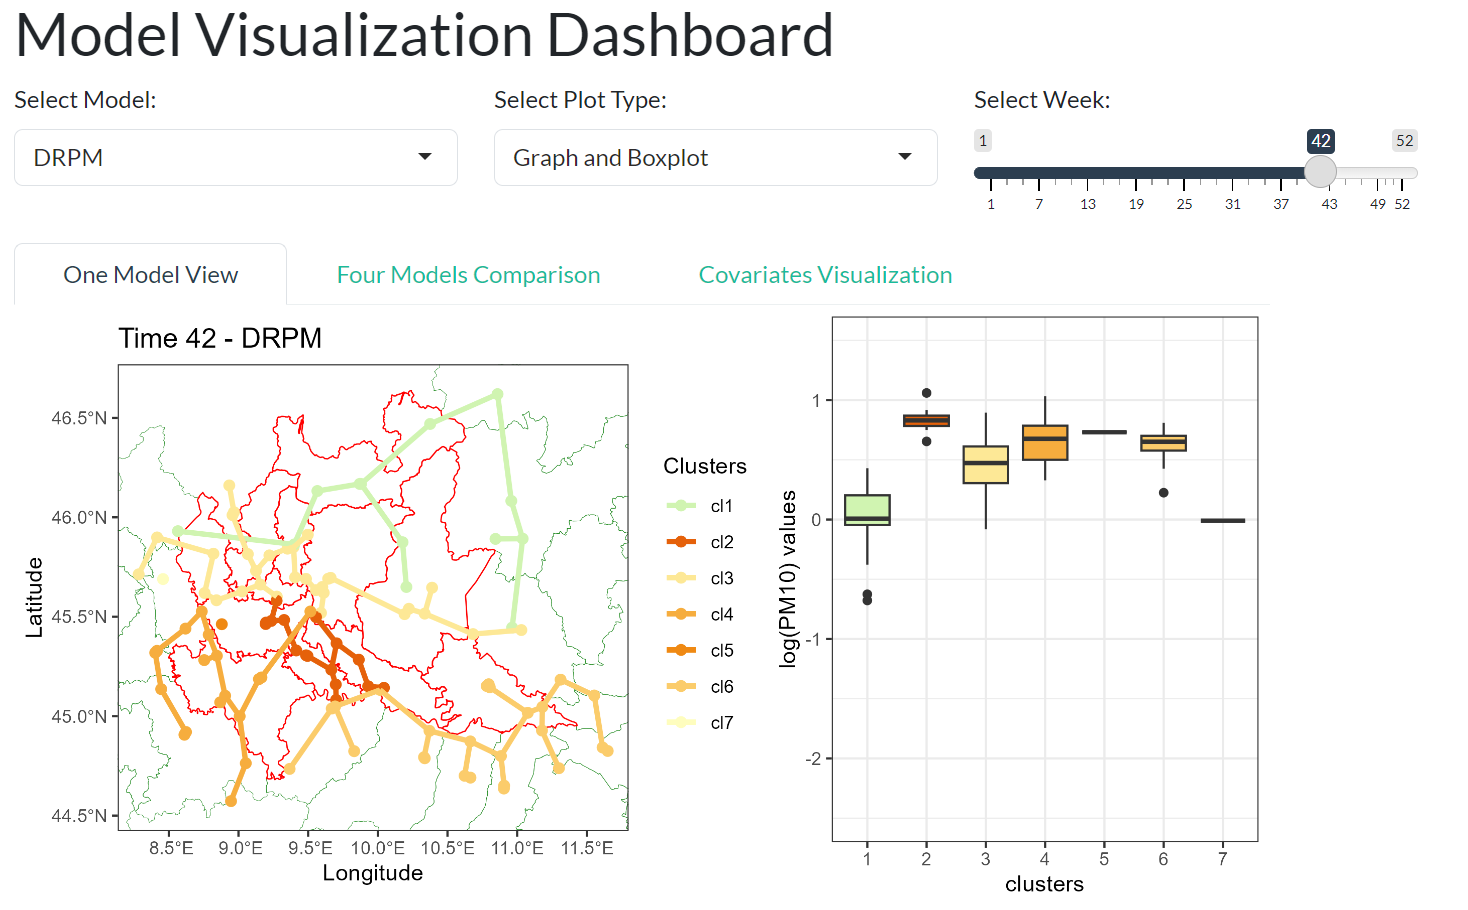
We also created a dashboard, combining some html and javascript (though a draft was also made directly in R using R shiny dashboards), to display and study all the plots that we generated during our analysis.
Github repository: https://github.com/federicomor/progetto-bayesian.
final dashboard, created as a web page using html, css, and javascript
draft of the dashboard created using R Shiny Dashboard